The Department of Energy and Environment (DOEE) and its partners have invested tens of millions of dollars into energy projects across the District, reducing utility costs, modernizing buildings, and cutting greenhouse‑gas (GHG) emissions. The Strategic Energy Investment Dashboard (SEID) map brings these investments together in one place, showing where dollars were invested and the types of energy projects that are happening in every ward, ANC, and Census tract.
The SEID map categorizes the types of energy projects designed to help residents and businesses save money and reduce emissions. Energy efficiency programs, offered by the DC Sustainable Energy Utility (DCSEU), reduce energy usage by upgrading appliances or improving building performance through equipment, such as smart thermostats. Electrification programs, also offered by the DCSEU, replace gas systems with cleaner, more efficient electric options, such as heat pumps and induction stoves. Solar projects, offered through DC Solar for All, harness solar radiation to power homes, businesses, and community spaces while reducing constituents’ energy bills. Loan programs, offered by the DC Green Bank (DCGB), provide affordable financing to make clean energy and efficiency upgrades possible, supporting a greener and more resilient future. For more information on project types along with examples, please see ‘Glossary’ on the SEID.
A Shift in How and What DOEE Funds
There are striking differences in overall scale of investment across the different categories. DOEE’s funding approach throughout the years has evolved, guided by Mayor Bowser’s initiatives, such as Clean Energy DC and Sustainable DC, as well as DOEE’s programmatic growth goals.
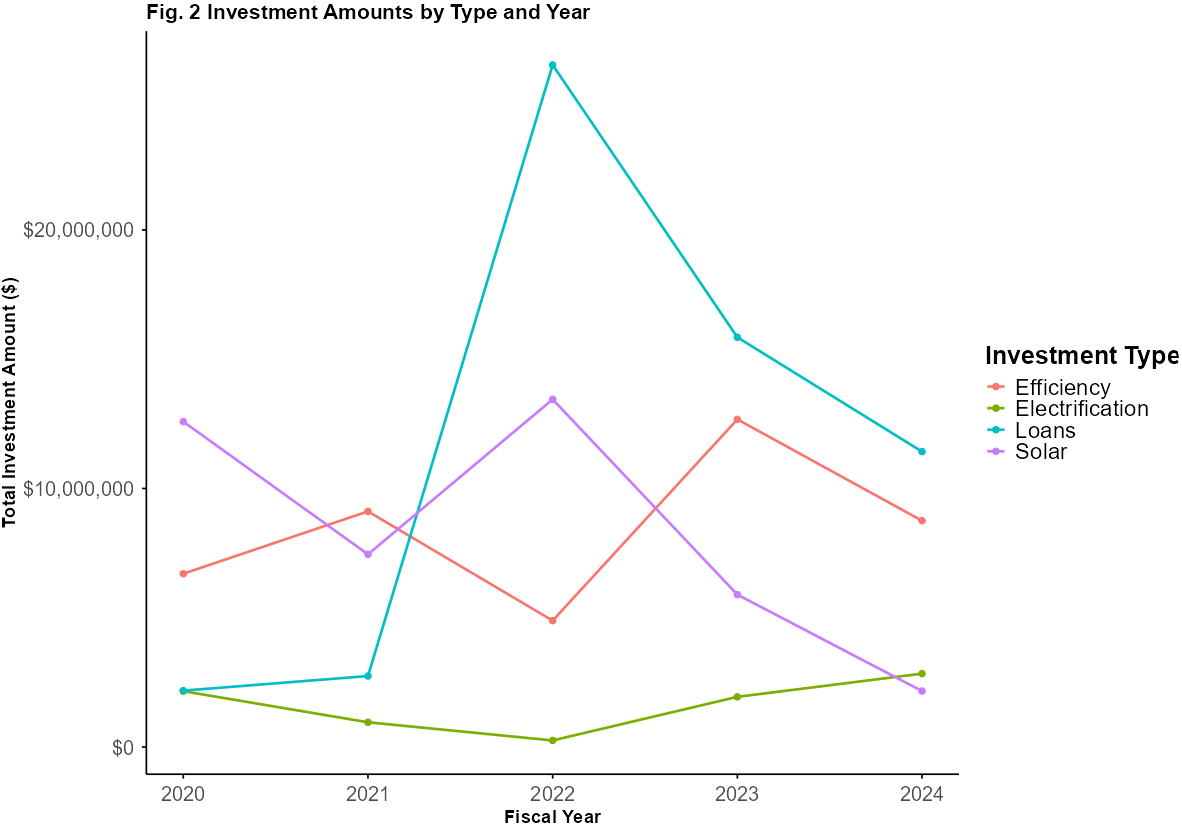
Loan programs saw the largest surge in investments, jumping from $2.75M in 2021 to $26.38M in 2022 (an 870% increase) before declining in subsequent years. Solar funding also spiked in 2022 (driven by a massive increase in the development of Solar for All’s community solar generation facilities and its single-family home installations), reaching $13.45M, but fell sharply by 84% by 2024 (decreases observed mostly by Solar for All’s programs). Efficiency investments grew steadily, peaking at $12.67M in 2023 before easing in 2024, while electrification expanded more than tenfold by 2024. These trends highlight how investment strategies continue to evolve as programs adapt to new technologies and funding opportunities.
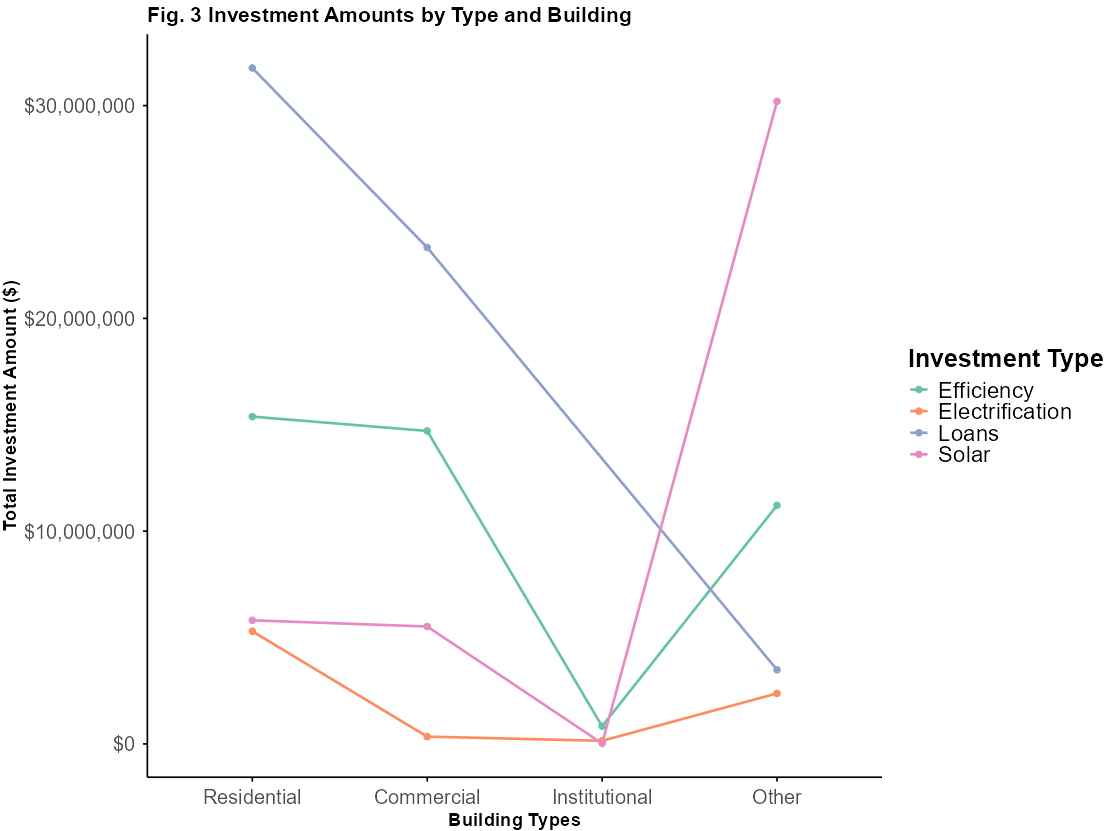
Investments impact all building types in the District, with residential properties receiving the largest share across a few key categories ($15.38M in efficiency upgrades, $5.29M in electrification, and $31.77M in loans), underscoring efforts to reduce household energy burdens. Commercial buildings also attract significant funding, including $23.33M in loans and $14.71M for efficiency projects, reflecting ongoing efforts to improve energy performance and sustainability in larger spaces. In contrast, institutional buildings, such as schools and churches, have seen less investment, with totals under $1M in most investment categories, highlighting a gap compared to other building types.
Taken together, these trends of investments and building types reveal where progress is concentrated and where opportunities remain for a more balanced clean and efficient energy transition. While reviewing these trends across multiple years provides valuable context, focusing on the most recent data in 2024 is key to understanding current priorities and where DOEE is headed next.
Zooming in: 2024
In FY24, DOEE invested $30.6M into projects across 2,109 mapped buildings (An additional $385,000 investments did not have geographic locations tagged). Partner organizations, including the DCSEU and DCGB, played central roles in getting this work done.
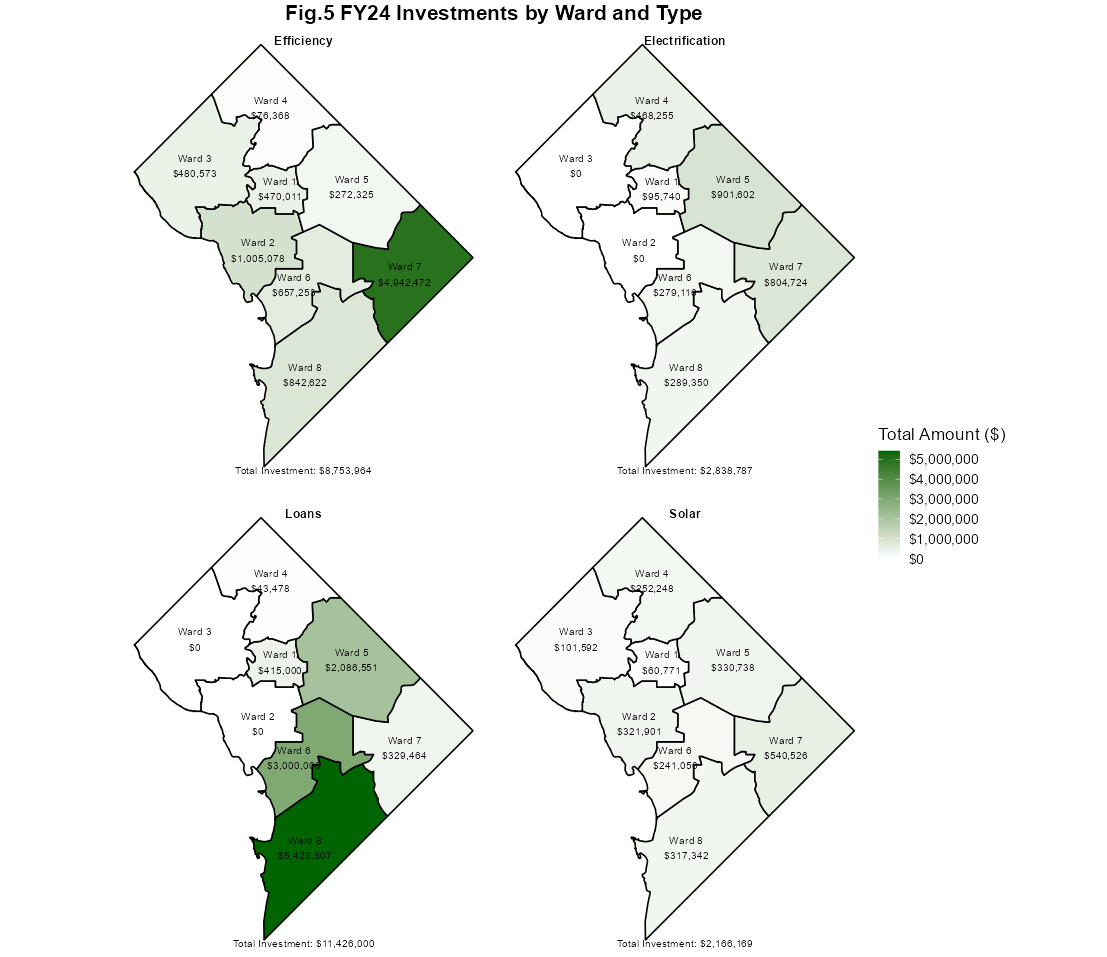
For years, the DCSEU has been DOEE’s primary conduit for conserving energy and saving residents money through rebates and direct installation measures. Those efficiency programs continue to deliver citywide benefits in homes and multifamily buildings. In FY24, the DCSEU began scaling electrification efforts, helping income‑qualified residents switch from gas to efficient electric heating, cooling, water heating, and cooking. Efficiency investments are concentrated heavily in Ward 7, which claims close to $5M of the total, accounting for 75% of all efficiency investments in the District. (To explore more of how the DCSEU has invested in the District, filter for ‘Sustainable Energy Utility’ under ‘Partner’ on the upper right-hand-side of the SEID map).
In partnering with DCGB, more funding began to flow through loans that unlock large, capital-intensive projects, particularly in affordable housing and community-serving buildings. In FY24, loan investments were the single largest investment category at $11.4M (about 37% of mapped dollars), with Ward 8 receiving nearly half of that total. DCGB provides affordable loans to support clean energy and climate resilience projects across the District, including solar installations, energy-efficient building upgrades, transportation electrification, and flood mitigation efforts. One big driver of this investment in Ward 8 (about $3M) is an affordable Passive House-certified building at Barry Farm, encompassing 139 new sustainable units (To read more about the project click here).
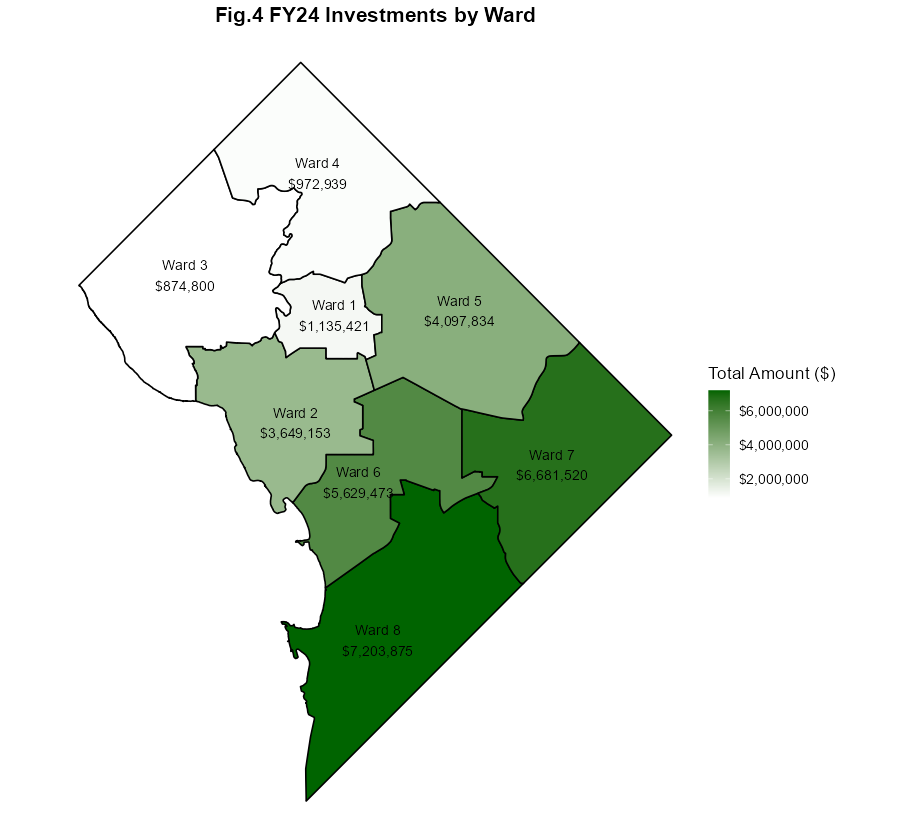
Going Where It Matters Most: Wards 7 and 8
In FY24, every ward received investments in efficiency and clean energy, but the largest investments were concentrated in Wards 7 and 8, totaling $6.7M and $7.3M respectively. In Ward 8, neighborhoods like Shipley Terrace, Barry Farm, and Congress Heights accounted for about 81% of the ward’s total received investments, driven by DCGB loans for major multifamily and efficiency projects. Ward 7 saw a similar pattern, with neighborhoods from Kenilworth and Mayfair capturing 84% of its funding through affordable housing retrofits and deep efficiency upgrades. Take a look at Paradise at Parkside, which has benefited from electrification improvements to enhance indoor air quality and energy savings for residents. Projects like these demonstrate how clean energy investments can deliver both health and affordability co-benefits.
Wards 7 and 8 focused funding on fewer projects but those projects were larger (driven by loans and comprehensive retrofits), while projects in Ward 2, for example, saw several smaller measures (e.g., lighting and equipment upgrades). In other words, big investments have been concentrated on large, building‑level transformations in lower-income neighborhoods.
Key takeaways from FY24:
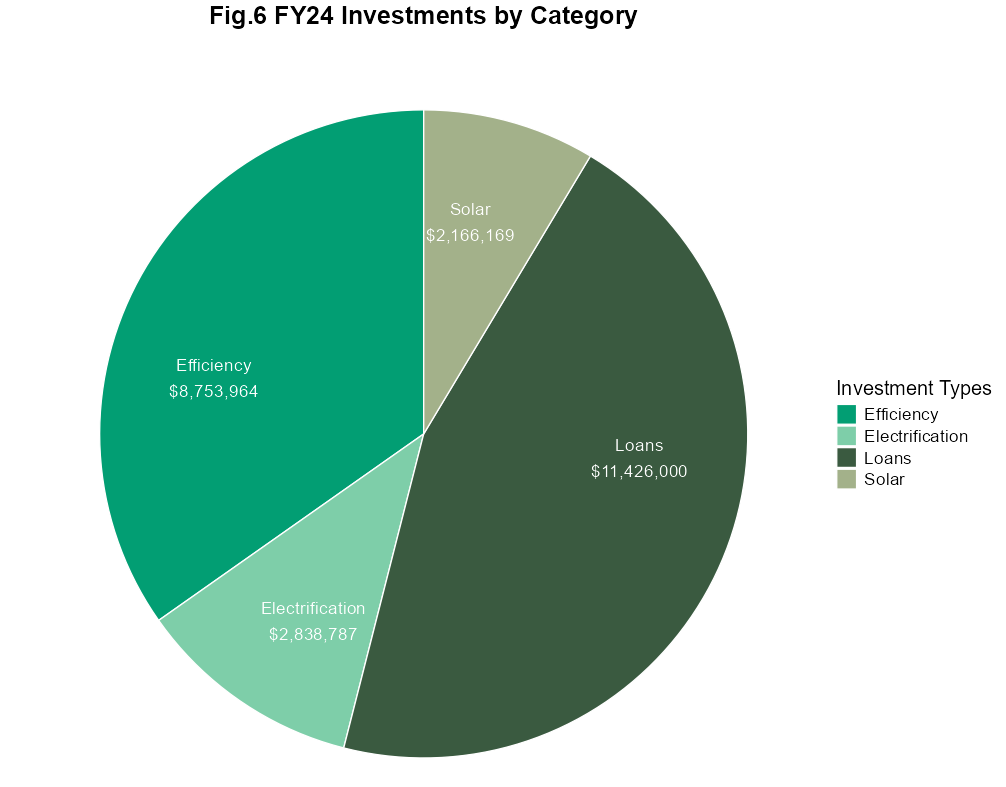
- Loan-based investments topped the four categories of investment with $11.4M, enabling large, capital‑intensive upgrades, especially in Ward 8.
- Efficiency investments were second highest at $8.75M, with citywide reach and significant activity in Wards 7 and 8.
- Electrification projects rose to $2.84M, centered in Wards 4, 5, and 7, and this category is poised for growth with the expansion of the Affordable Home Electrification Program (AHEP) and other home electrification investments.
- Solar totaled $2.17M from the DCSEU’s Solar for All and Market Rate Renewables and the District Department of Transportation’s Solar Capital Bikeshare stations; future recategorization of certain loans may reveal more solar activity embedded in other categories of financing.
What’s Next
DOEE and its partners have expanded efforts in FY25, with AHEP moving from the pilot phase to its expanded program phase and more financing tools becoming available to residents. Visit the DCSEU’s website to explore the suite of energy efficiency and electrification measures available to District residents. Continue to check in on DOEE’s investments as the SEID map is updated annually.