As weather patterns grow volatile and energy costs continue to climb, residents across DC are increasingly feeling the pressure of rising utility bills. Low-income households bear the brunt of this burden, often facing difficult tradeoffs between paying for heat, electricity, and other basic needs. This post examines how energy assistance programs help lower the energy burden of low-income families in DC during fiscal year 2025 (FY25, which runs from October 1, 2024-September 31, 2025).
DOEE offers a variety of programs that help residents lower their energy bills and make their homes more energy-efficient. The Low-Income Home Energy Assistance Program (LIHEAP)1 is a federally funded2 program that provides critical relief to DC residents struggling with high energy costs. Eligible residents can receive a one-time benefit of $200 or more each fiscal year and this can be applied to gas, electricity, or heating oil bills. This assistance helps ease financial stress and support year-round household stability. When residents enroll in LIHEAP, they are automatically eligible for several additional utility assistance programs. The LIHEAP application also serves as the application for the Utility Discount Program (UDP), which consists of three programs:
Washington Gas’s Residential Essential Service (RES) program
DC Water’s Clean Rivers Impervious Area Charge Relief (CRIAC) program
In addition to these programs, enrolling in LIHEAP also makes households eligible to participate in SFA,3 which provides long-term electric bill savings through community solar benefits. SFA currently requires households to submit a separate application specific to SFA.
This post will focus on energy trends among residents who qualified for FY25 LIHEAP assistance by falling at or below 60% of the state median income (SMI). During FY25, over 18,000 applicants sought LIHEAP support and approximately 16,400 households ultimately received benefits. The following analysis of energy trends will look at a portion of these LIHEAP households and examine their energy usage by looking at their electric and gas bills throughout the fiscal year.4 By focusing on this group, program staff can better understand how energy costs impact low‑income residents and highlight patterns that can inform future program planning.
Energy burden among LIHEAP households
Energy burden is defined as the portion of total income spent on utility bills. It is calculated as:
\[ \text{Energy Burden (\%)} = {\frac{Energy Spending (\$)}{Household Income (\$)} x 100} \]
According to the Department of Energy’s (DOE) Low-Income Energy Affordability Data (LEAD) Tool,5 the average energy burden for DC households is 1%. Comparing this to a sample of FY25 LIHEAP applicants, the picture shifts dramatically. If these low-income households had not applied to LIHEAP or any other form of utility assistance, their average energy burden would climb to 24%. To put that in perspective, a 6% burden or higher is considered a “high” energy burden, and 10% or higher is considered “severe.”6 Without LIHEAP assistance, the average energy burden in our sample is 24%, but the median energy burden is 12%, meaning half of all households have energy burdens below 12%. That gap between the two numbers suggests a smaller group of residents with extremely high energy burdens is pulling the average burden up. To show how unevenly this cost pressure is felt, the figure below highlights the distribution of energy burdens among households in the sample.
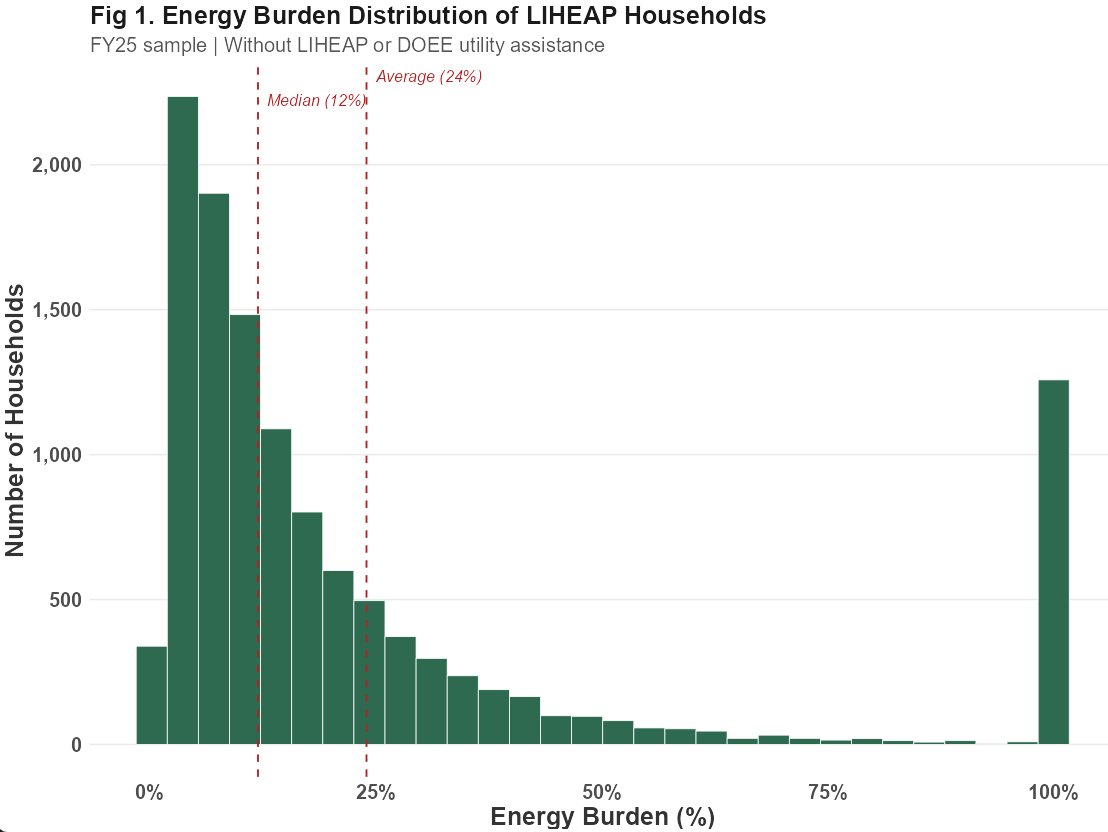
Most LIHEAP households in the sample fall between a 5% and 15% energy burden, but even households closer to the 5% burden range still have energy burdens consider high to severe. Although the distribution of energy burdens skews to the right, there are still about 28% of these sampled households with energy burdens above 24%). The interesting thing to note about this graph is the spike at 100% on the x-axis. These households have energy costs equal to or exceeding their entire reported income (10% of FY25 LIHEAP households have no annual income to report, making any utility costs equivalent to energy burdens of 100%). To better understand how assistance programs help close this gap, the following section examines how income levels and utility assistance benefits can make energy costs more affordable.
DOEE utility assistance
In FY25, DOEE distributed $14.2 million in LIHEAP assistance, of which $9.1 million (64% of total funding) came from federal sources, with the remainder drawn from local sources, such as the Energy Assistance Trust Fund (EATF), funded by a small surcharge on gas and electricity sales. To determine how much assistance each household receives, DOEE uses a benefit matrix, which weighs four key factors:
Household income
Number of people in the household
Home type (i.e. single-family or multi-family)
Main heating fuel type (gas, electric, oil, or heat included in rent).7
This information is gathered during the application process and applied through the matrix, which then determines the amount of LIHEAP benefits households will receive. The average benefit per household in FY25 was $864. To understand who LIHEAP is truly serving and how much relief it provides, it helps to look at income, energy burden, and amount of benefits allocated. See a summary in the table below.
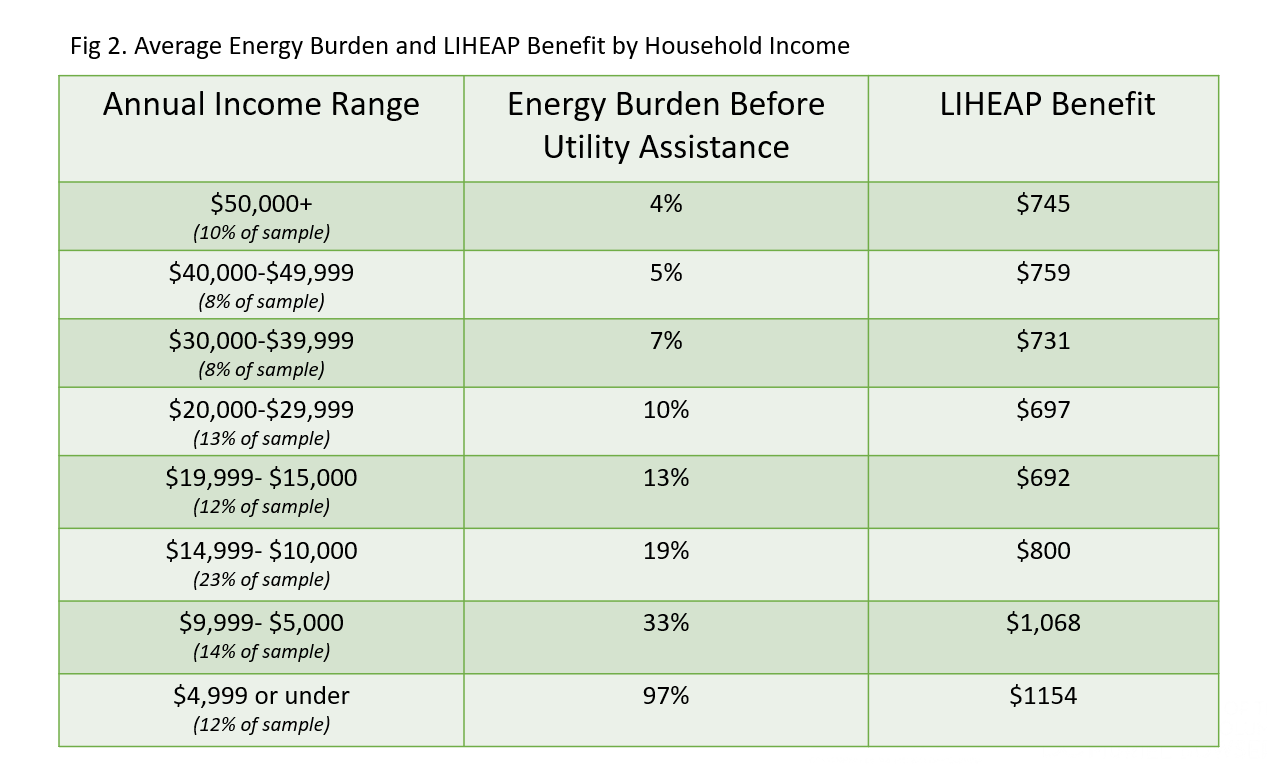
This chart demonstrates that LIHEAP benefits do scale with need, rising from roughly $690–$800 for households with annual income between $10,000 and $30,000 to above $1,000 in benefits for the lowest‑income groups. This matters because nearly half of the sample earns below $15,000, meaning the most extreme energy burdens (33% to 97% of income) are concentrated among the largest share of beneficiaries. While benefit patterns suggest that assistance meaningfully reduces pressure on the tightest budgets, cash benefits can only go so far. As mentioned previously, about 10% of the LIHEAP population reports having no annual income, making their energy burden 100%. That’s when it becomes important for households to tap into DOEE’s broader suite of energy assistance programs.
Expanding benefits through other energy assistance
Applying for LIHEAP opens the door to a suite of additional utility discount programs that can significantly reduce what residents pay every month. UDP is available to households earning up to 80% of area median income (AMI), a broader eligibility threshold than LIHEAP’s 60% of SMI, meaning more residents qualify.
For a low-income resident, the value of LIHEAP extends beyond LIHEAP benefits alone; it unlocks access to other utility assistance programs that provide relief to households. Of the approximately 16,400 households that received LIHEAP benefits in FY25, 97% were also enrolled in Pepco’s RAD, a credit applied directly to the distribution portion of an electric bill. Among the 3,459 LIHEAP households with gas accounts, 97% were enrolled in Washington Gas’s RES, which provides a seasonal discount on natural gas bills. On average, RAD delivered $416 in annual savings (n=11,379) and RES delivered $461 in annual credits (n=1,892), which provided meaningful relief in addition to LIHEAP benefits.
Beyond discounts on utility bills, LIHEAP enrollment also serves as a direct enrollment pathway to SFA, which provides rooftop solar systems to select single-family homes and community solar electric bill credits to low-income residents. Through this pipeline, 3,247 LIHEAP households were successfully enrolled in SFA, and they received an average of $549 in solar electric bill credits annually.
Together, DOEE’s utility assistance programs layer multiple forms of relief to address households’ energy costs. The chart below shows what that actually means in practice, comparing residents’ energy burdens before and after all discounts and credits are applied.
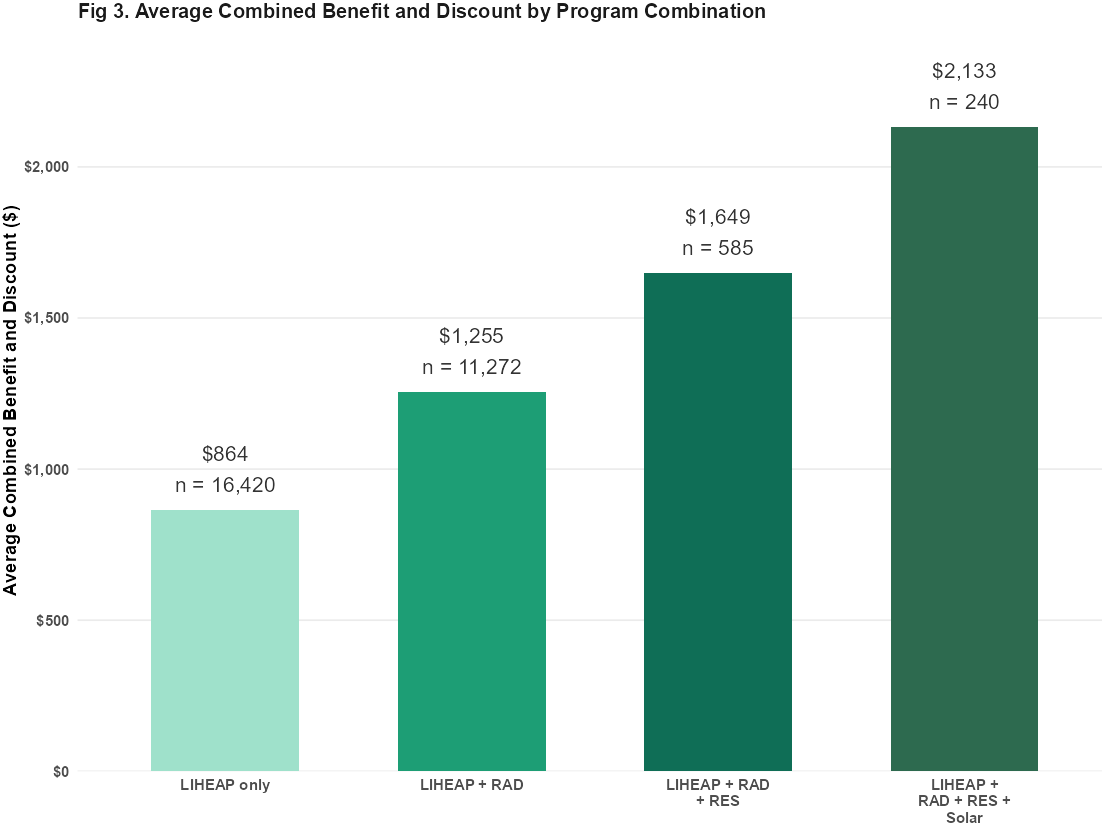
Households enrolled in all four programs received an average of $2,133 in combined assistance, which is more than double the average LIHEAP benefit of $864. However, assistance amounts alone do not tell the full story of energy burden relief; what matters most to a household struggling to pay utility bills is not how much assistance is received, but the extent of energy costs that remain after the assistance is depleted. The figure below illustrates how each additional program layer drives down energy burdens and whether relatively comprehensive combinations of assistance are enough to bring low-income households below the severe burden threshold.
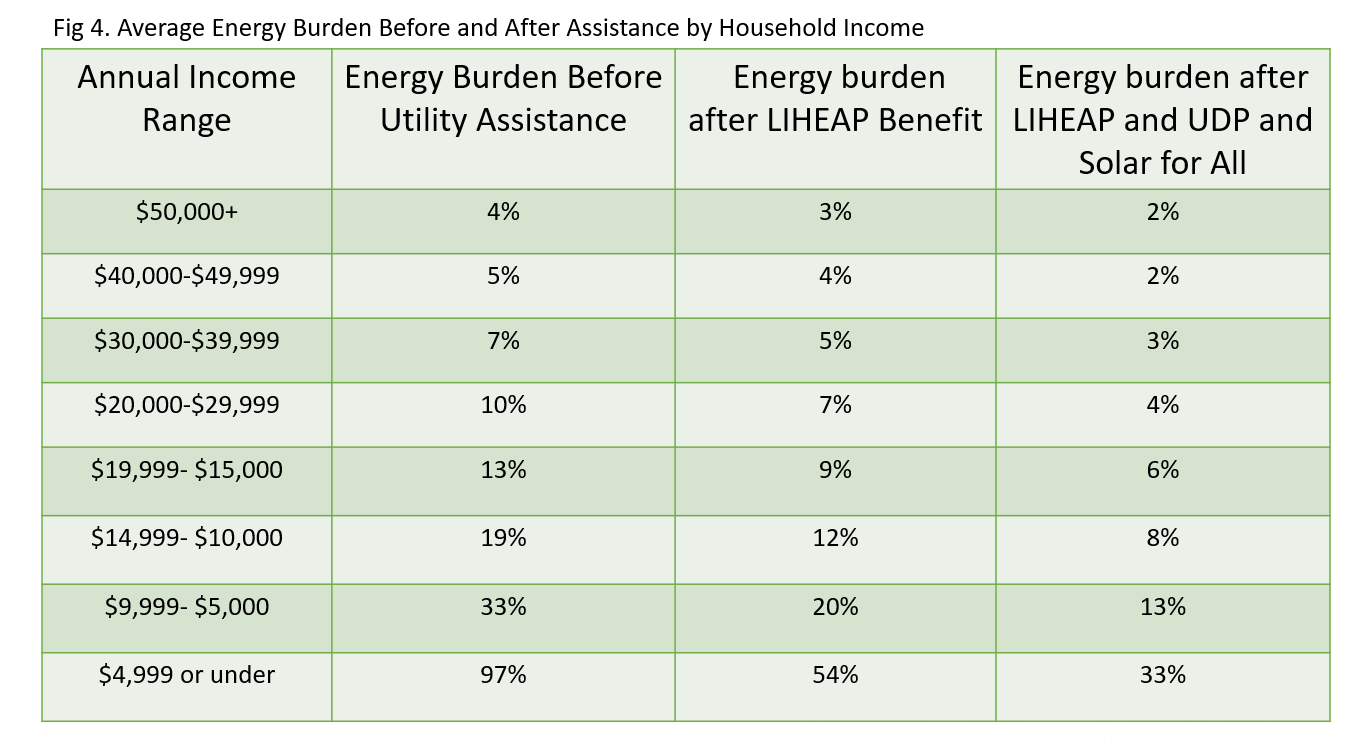
The table highlights how dramatically energy burdens fall when multiple forms of assistance are applied together. For a significant portion of the LIHEAP population, these programs successfully bring household energy burdens to more affordable levels. Households earning above $15,000 (roughly 38% of the sample) see their energy burdens reduced to 6% or lower after all assistance is applied, crossing below the threshold that experts define as a high burden and suggesting that for this group, the current suite of programs is working as intended. For households earning between $5,000 and $14,999, combined assistance cuts the burden roughly in half, which is a significant reduction. The most striking finding remains at the bottom of the income distribution: households earning under $5,000 see the largest absolute reduction, from 97% all the way down to 33%. However, even after receiving LIHEAP, RAD, RES, and SFA simultaneously, households are still spending a third of their annual income on electric and gas bills alone, underscoring that for the most vulnerable residents no combination of current programs is sufficient to bring energy costs to an affordable level.
There’s been progress but work remains
The data presented in this post tells an encouraging story: DC’s utility assistance programs are working to lower residents’ energy burdens. For households earning above $15,000, the combination of LIHEAP, RAD, RES, and SFA successfully brings energy burdens below the 6% affordability threshold, meaning these programs are delivering real, measurable relief to DC residents who are enrolled in the programs. With the average household enrolled in all four programs receiving over $2,100 in combined annual assistance, the compound impact of stacking multiple programs together is clear: the more programs a household is enrolled in, the lower the energy burden.
The data also makes clear that enrollment in utility assistance programs remains the missing piece for too many households, particularly the most vulnerable. While 97% of LIHEAP recipients are enrolled in RAD, far fewer are enrolled in RES and SFA, and households with the lowest incomes still face an average 33% energy burden even after all available assistance is applied.8 Maryland, Massachusetts, New York, Connecticut, New Jersey, and Texas have established partnerships through data-matching between public agencies and utilities to dramatically expand enrollment in utility assistance programs on an opt-out basis. This reduces the administrative burden on households that already qualify through other public benefits programs. The DC Council is considering legislation that would require a similar automatic enrollment system to be launched in DC.
Finally, it is important to recognize that energy burden is only one dimension of household energy insecurity. Even when assistance reduces monthly costs, many families continue to face challenges, such as arrearages, disconnection notices, service shutoffs, and/or issues with financial and health consequences. To fully understand energy insecurity in DC, future analyses must also examine arrearages trends, disconnection practices, housing quality, appliance efficiency, and the behavioral and health impacts of energy insecurity. Only by looking at all these factors together can policymakers see the complete picture of how households navigate the utility system and where additional support is needed most.
Footnotes
To learn more about LIHEAP in DC and its eligibility requirements, please visit doee.dc.gov/liheap. Although this post examines the impact of FY25 activity, LIHEAP funding for DC was depleted by March 2025. It is common for each year’s LIHEAP funding to be depleted well before the end of the fiscal year.↩︎
Note that federal funds are commonly supplemented with local funds in DC.↩︎
To learn more about SFA, please visit https://doee.dc.gov/solarforall↩︎
This portion of households was selected based on enrollment in utility assistance programs and the availability of complete annual energy data from electric and/or gas bills.↩︎
DOE’s LEAD Tool can be found here: LEAD Tool: https://lead.openei.org/.↩︎
This definition is supported by the DOE, Applied Public Policy Research Institute for Study and Evaluation (APPRISE), and the American Council for an Energy-Efficient Economy (ACEEE).↩︎
The FY26 benefits matrix can be found here: https://doee.dc.gov/sites/default/files/dc/sites/doee/service_content/attachments/DC%20DOEE%20-%20FY26%20LIHEAP%20Benefit%20Matrix.docx.↩︎
Enrollment in RAD, RES, and SFA is guided by household utility type and program-specific requirements. For example, RAD serves electric customers and RES supports gas customers.↩︎