Less Than One year to showtime: measuring current impact of the building energy performance standards
This is an updated version of the original post from December 27, 2025.
The Context
January 1, 2026, marked a critical milestone for owners of large buildings in the District – t-minus one year until BEPS evaluation. The first compliance cycle of the District’s Building Energy Performance Standard Program (BEPS) is almost over. Building owners now have less than one year left to demonstrate energy savings to comply with a compliance pathway.
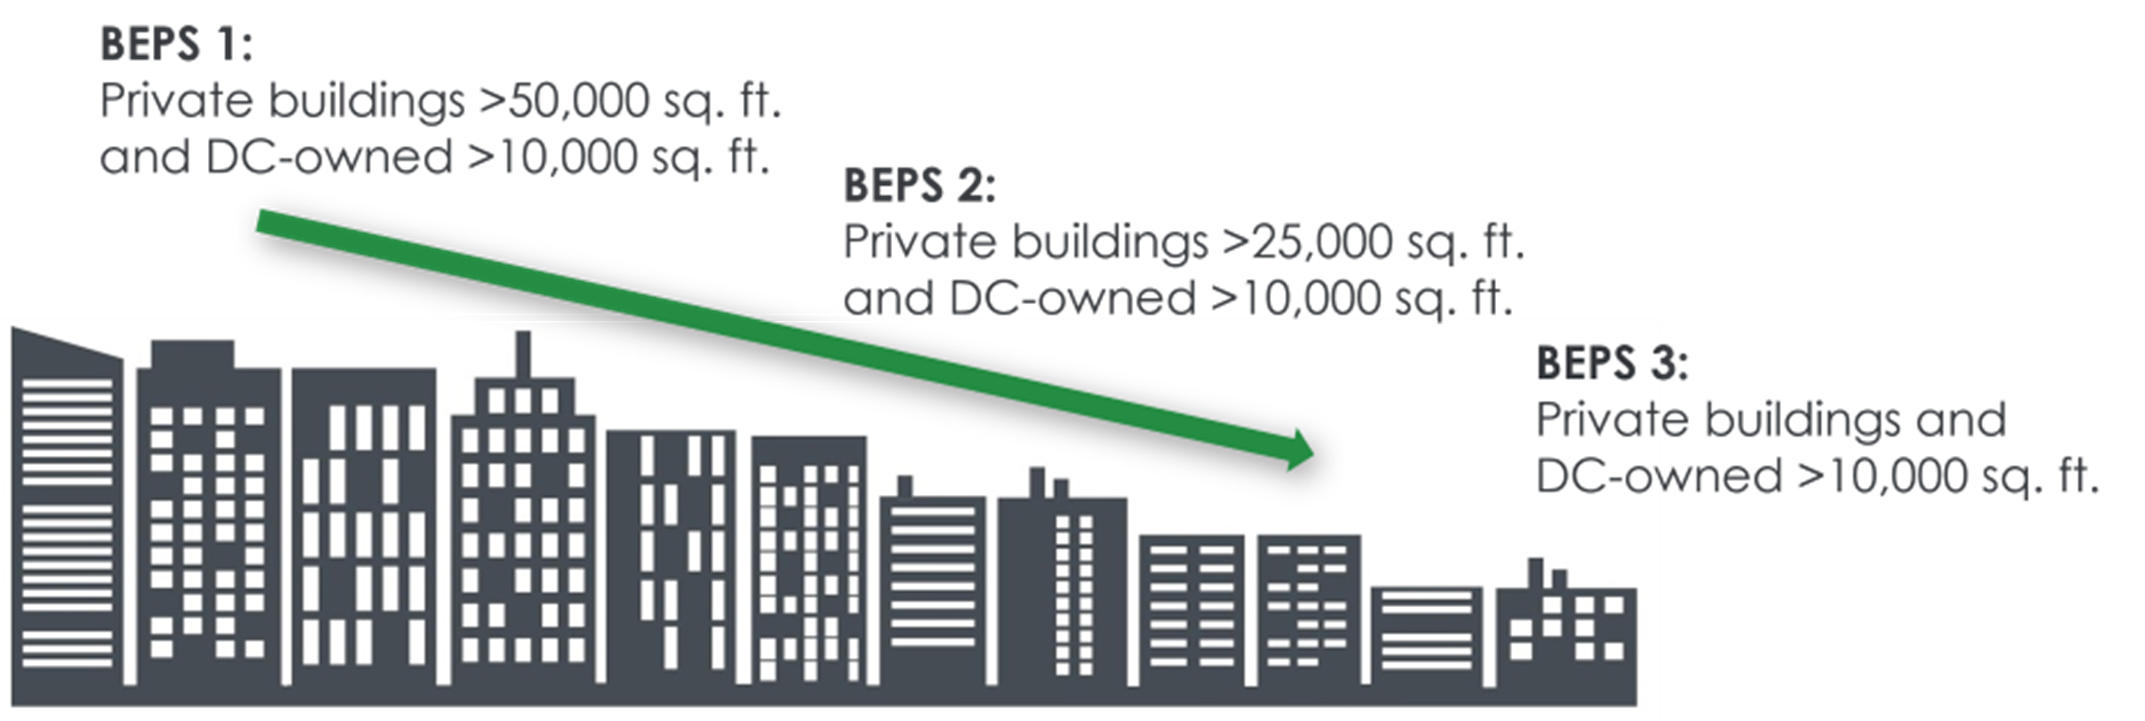
For the uninitiated, BEPS was created in 2018 to help the District meet the energy and climate goals of the Sustainable DC Plan. The BEPS are set every six years (starting on January 1, 2021) as a minimum level of energy performance, typically measured in ENERGY STAR® score.1 Buildings that don’t meet the BEPS are then given five years to complete a compliance cycle by demonstrating improved energy performance.2 In most cases this equates to a 20% reduction in energy consumption per square foot (energy use intensity or EUI). However, some buildings acan also just save enough energy to meet the BEPS. For example, if the standard is an ENERGY STAR score of 66 and a building has a score of 60, they can achieve a score of 66 and comply.
For the first cycle, private buildings at least 50,000 square feet and DC-owned public buildings at least 10,000 square feet were subject to the BEPS. In future cycles, the program will apply to smaller private buildings.
While evaluation of compliance won’t happen until the end of 2026, I wanted to conduct an analysis of how many buildings are “on-track” to comply with the BEPS program. I want to understand if buildings are starting to demonstrate energy savings and if so, how much? I also want to understand if savings are unique to buildings on a compliance cycle or if all buildings are improving their energy performance?
The approach to measuring progress
All buildings subject to BEPS are also required to comply with the District’s energy and water benchmarking program.3 This annual requirement gives DOEE and the public a sense of how buildings perform year over year. In addition to energy consumption, buildings are required to report operational details (e.g., number of workers, operating hours, percentage of the building that can be heated/cooled). This data gives DOEE an accurate assessment of the energy consumption and operating conditions of buildings subject to benchmarking.
However, given all this information, it can be hard to determine if buildings are on track to meet their compliance targets. First, building owners are at different stages in their compliance plans. Some building owners have taken early action, implementing Energy Efficiency Measures (EEMs) quickly to ensure they have time to fine-tune systems to maximize efficiency gains; some building owners have opted to implement EEMs later in the compliance cycle to take advantage of a longer planning process; and some building owners implemented a series of smaller EEMs at a regular pace along the compliance cycle to make compliance a more manageable task.4 Thus, without details on what each building owner is planning it can be hard to understand if buildings are on track to compliance.
Additionally, different factors like weather and changes in occupancy and tenants can impact a building’s energy performance each year thus creating a complicated picture. A building owner might be ahead of schedule in implementing EEMs, but a given year’s weather might impact the heating/cooling requirements of the building making its energy consumption go up. Figure 2 below shows how unique conditions of a given year might impact a hypothetical office building’s energy performance.5
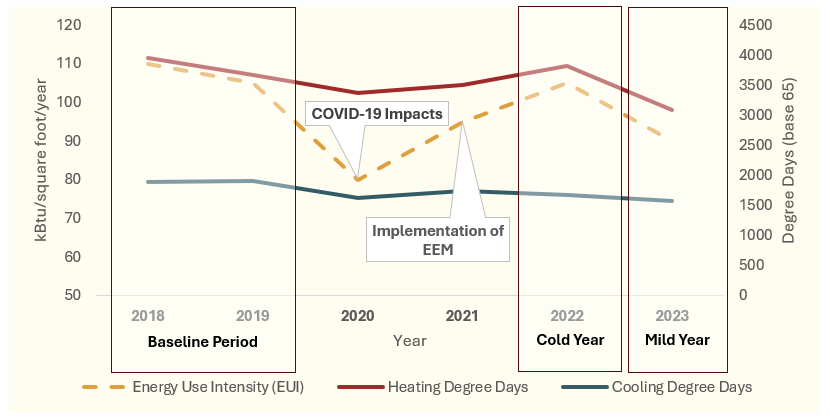
In this example, the building’s baseline period is comprised of the relatively cold calendar years 2018 and 2019 causing higher energy consumption due to increased heating loads.6 During the COVID-19 Public Health Emergency (PHE) there is a serious decline in energy consumption due to stay-at-home work schedules in 2020. Resourcefully, the building owner uses the lack of tenants in the building to implement an EEM, so that in 2021 the building has begun to show some energy savings. However, in 2022 there is a relatively cold winter requiring higher heating loads than usual resulting in a spike in energy consumption for that year. Thankfully, in 2023 the weather is relatively mild, and the building shows improved energy performance from the baseline, because of the EEM.
Thus, one can see how variations from year-to-year might impact a building’s compliance status with BEPS. However, what happens if 2026 is an unusually cold or hot year? Or if a building changes tenants and the new tenant has high energy intensity requirements (e.g., a call center)? To try and estimate if buildings are on track to meet the BEPS compliance requirements changes in weather and operating conditions must be taken into account.
The solution, the problem, and the solution
The U.S. Environmental Protection Agency (EPA) ENERGY STAR® program has come up with part of the solution to this question – adjusting benchmarking data based on operating characteristics. Using benchmarking data, a building can see what their energy performance would have been had they been operating like another year. Using the example above, a building’s baseline performance data can be adjusted to how it would have performed if it had experienced 2023 weather in 2019. This normalization process is called “Adjusted to Current Year.”
EPA makes Adjusted to Current Year metrics available to all buildings that can receive an ENERGY STAR score in ENERGY STAR® Portfolio Manager® (ESPM).7 They allow the user to view past years of energy performance (like site EUI) adjusted to the weather and property operations of the current year. The current year is defined as the latest complete year of data entered in ESPM. Thus, if a building has input data up to July 31, 2024, then all past year metrics will be adjusted to the current year of August 1, 2023 – July 31, 2024.
The problem with ESPM’s Adjusted to Current Year metrics is the limitation hinted by the title. The user cannot select which year is the “current year”. It would be ideal to look at all covered buildings adjusted to calendar year 2024, but some buildings have begun to input data in calendar year 2025. Thus, the “current year” will not align for all buildings, which presents a challenge in using it as a standardized approach to measuring progress.
Additionally, Adjusted to Current Year metrics require us to rely on data in ESPM, not compliant benchmarking data. This distinction is a subtle one. While DOEE does have access to building’s live ESPM data via the benchmarking reporting process, often after building owners have reported data to DOEE for benchmarking they might go back and change the data in ESPM. Thus, what is in ESPM might differ from what is in DOEE’s compliance management software. DOEE only considers what was reported as official data and might not catch changes to ESPM. Even if DOEE did catch the change, it’s possible the new data in ESPM might have errors, and without reporting it, DOEE has no way of confirming if the new data is complete and accurate. For these two reasons, relying on ESPM Adjusted to Current Year Metrics presents a problem for this analysis.
To address this, the RAD team worked with DOEE’s Building Performance Division (BPD), the part of DOEE responsible for implementing the BEPS and benchmarking programs, to adapt EPA’s Adjusted to Current Year methodology. This solution, which was rolled out in the Building Energy Analysis Manager (BEAM) tool, enables DOEE to take any year of benchmarking data for a given building and adjust it to another year for that same building.8 Using this new methodology, adjusted metrics from any reported year can be calculated to measure progress while controlling for changing weather and operating conditions.
The analysis
To start, I narrowed down the scope of the analysis. I only looked at progress for three of the most common property types covered under BEPS: multifamily housing, office, and hotel. Additionally, I limited the data to just buildings that did not meet the BEPS and have compliant reports for both 2019 and 2024. For this analysis, this left us with roughly 360 buildings that did not meet the BEPS.
To measure progress, I used calendar year 2019 and 2024 benchmarking data. For simplicity, I used 2019 calendar year data as the baseline, instead of the average of 2018 and 2019 as required by law. Additionally, I used 2024 as the temporary evaluation year as that is the latest year of complete and accurate benchmarking data available to DOEE.9
Finally, when calculating adjusted to current year, I made the decision to adjust 2024 data back to 2019. While technically the “year being adjusted to” (e.g., 2024) will have no impact on the final progress calculations (meaning that the adjustment will be the same if I adjust to 2019 or 2024), I chose to adjust to 2019 so that future versions of this analysis will be comparable. This way the analysis is comparable to the previous analysis using 2023 data and will be comparable to a future 2025 analysis.
After applying analytical filters and calculating adjusted to current 2019 metrics I was able to calculate site EUI savings from 2019 to 2024. Table 1 summarizes the results.
| Property Type | Number of Buildings | Average 2019 Site EUI | Average 2024 Site EUI Adjusted 2019 | Average Site EUI Reduction | Average Site EUI Percent Reduction10 |
|---|---|---|---|---|---|
| Multifamily Housing | 184 | 68.4 | 60.57 | 7.83 | 10% |
| Office | 151 | 73.5 | 63.68 | 9.83 | 13% |
| Hotel | 25 | 116.7 | 97.25 | 19.45 | 16% |
| All Buildings | 360 | 86.2 | 73.83 | 12.37 | 13% |
Table 1. Average Site EUI Reduction by Property Type
Among this sample of buildings in the BEPS compliance cycle I found that significant progress has been made towards reducing energy consumption, even while adjusting to 2019 weather and operating conditions. Hotels and offices have made significant savings, with 16% and 13% savings over the baseline respectively. In a good piece of news, it appears multifamily housing buildings are catching up to the other property types when compared to the 2023 analysis. Multifamily housing buildings are now showing a10% savings over the baseline, whereas last year they were only showing 5%
But what does this mean in terms of progress towards compliance? As mentioned earlier, not every building needs to achieve 20% savings. Some buildings only need to meet the BEPS to comply. While most buildings have their BEPS expressed in ENERGY STAR score, it is possible to derive the site EUI reduction necessary to achieve a certain score. For example, most Multifamily Housing buildings that have a starting score of 40 require a 16% reduction in EUI to achieve a score of 66. DOEE has published the estimated EUI reduction required to comply with BEPS as part of the BEPS data disclosure.11
Using this field, I devised a metric to measure if buildings are on track to be compliant in 2026. By assuming a linear reduction in site EUI over time until the evaluation year I estimated what the site EUI for each building should be each year if they are on this linear track. For example, if a building is expected to achieve a 12% reduction in site EUI, then building would achieve a 2% reduction each year of the compliance cycle. Therefore, in 2024 the building would have to have achieved an 8% reduction to be considered “on track.”
This “expected progress” site EUI can then be compared to the actual adjusted performance data to see if the building is “on track” to meeting their compliance target. To give buildings a buffer I allowed for a 10% variation from the expected site EUI reduction. For example, if a building was expected to achieve a 12% reduction by 2024 but only had 10.8%reduction, it would still consider “on track.” Table 2 summarizes the estimated progress and on track statistics.
| Property Type | Average 2024 Site EUI Adjusted to 2019 | Average Estimated Progress Site EUI | Percent on Track |
|---|---|---|---|
| Multifamily Housing | 60.57 | 62.96 | 65% |
| Office | 63.68 | 66.00 | 77% |
| Hotel | 97.25 | 105.45 | 80% |
| All Buildings | 73.83 | 78.14 | 71% |
Table 2. Measurement of Compliance Progress - Buildings that did not meet the BEPS
This table gives a clear picture as to where buildings are in the compliance cycle. Over 70% of buildings are “on track” to meeting their final compliance requirements under BEPS. Hotel and offices still show high levels of buildings being “on track.” Multifamily housing shows relatively lower levels, but still almost two-thirds of multifamily buildings are on track to meet their compliance requirements.
The final question this analysis raises is: are these savings trends truly the result of BEPS or the influence of general market forces? Are the economics of efficiency driving large energy savings in buildings in the District? Without a full market analysis this is hard to prove for certain, but one approach to testing this null hypothesis is to look at the performance data for buildings that did meet the BEPS and have no compliance requirements.
As with most things, the devil’s in the data. For this, I ran the same analysis on buildings that met the BEPS. Table 3 contains their results.
| Property Type | Number of Buildings | Average 2019 Site EUI | Average 2024 Site EUI Adjusted to 2019 | Average Site EUI Reduction | Average Site EUI Percent Reduction12 |
|---|---|---|---|---|---|
| Multifamily Housing | 340 | 49.55 | 47.95 | 1.59 | 3% |
| Office | 204 | 52.08 | 52.70 | -0.62 | -1% |
| Hotel | 40 | 78.14 | 78.73 | -0.59 | -1% |
| All Buildings | 584 | 59.92 | 59.80 | 0.13 | 0% |
Table 3. Energy Performance Progress - Buildings that did meet the BEPS
Looking at the results, I affirmed why these buildings met the BEPS in the first place. Across the board their EUIs are lower than their counterparts in Table 1. Additionally, in terms of performance over time site EUI marginally decreased to even a slight increase for the buildings that met the BEPS. This indicates that buildings not on a BEPS compliance cycle continue to be less focused on improving energy efficiency but are on average more efficient than buildings on a BEPS compliance cycle.
The bottom line
It appears that BEPS is having the desired effects on the building stock in DC. Buildings on a compliance pathway are making improvements to energy performance. Meanwhile, buildings not in the compliance cycle have maintained similar energy performance as the baseline period. Among those buildings on a compliance cycle, it appears that many building owners are implementing EEMs that put them on track to meet their overall compliance requirements. Over 70% of buildings are “on track” to meet their final compliance requirements under BEPS.
Footnotes
The ENERGY STAR score is a 1 - 100 measurement of how well a building is performing relative to similar properties nationwide. For most buildings, the BEPS is set in terms of the District median ENERGY STAR score for that building’s property type.↩︎
Six years for the first BEPS cycle because of the COVID-19 Public Health Emergency↩︎
An annual requirement for buildings in the District above a certain size to report previous year energy and water consumption and operating characteristics to DOEE.↩︎
EEMs are a collection of system updates and organizational strategies that help a building reduce energy consumptions. A common EEM is upgrading lightbulbs to LEDs. EEMs are the primary way building owners improve the energy performance of their building to comply with the BEPS program.↩︎
Heating and Cooling Degree Days (HDD/CDD) – a measurement of the number of days you would have to heat or cool a building by 1 degree to accommodate the building’s heating/cooling requirement. For example, if you have a day on which the temperature is 55°F degrees, that day is worth 10 Heating Degree Days because it is 10 degrees below 65°F. Conversely, if you have a day on which the temperature is 75°F degrees, that day is worth 10 Cooling Degree Days. HDD/CDD is calculated in this way for each day of the year and summed up to get the total annual HDD/CDD.↩︎
This is evidenced by the relatively high levels of Heating Degree Days (HDD) in figure 2.↩︎
ESPM is web-based tool that enables buildings to track energy bills and building characteristics, measure energy performance over time, and report benchmarking data to DOEE.↩︎
BEAM is the compliance management software for both the BEPS and benchmarking programs.↩︎
Calendar year 2025 data is not due until May 1, 2026.↩︎
Note that average site EUI percent reduction is the average of the site EUI percent reduction for each individual building rather than the percent reduction between the average 2019 site EUI and average 2024 site EUI adjusted to 2019.↩︎
See the column “Building’s Energy Performance Requirement Estimated”.↩︎
This is the average of the adjusted site EUI percent reduction for each individual building rather than the percent reduction between the average 2019 site EUI and average 2024 site EUI adjusted to 2019.↩︎